![]()
One aspect of wireless networking that I’ve always struggled with is visibility into DFS events. Usually I catch them by chance by noticing two nearby AP’s on a site map using the same non-DFS channel, or maybe by casually looking through logs, but I’ve never felt like I had the reporting and alerting that should be in place for DFS events, because they can be very disruptive. An AP will abruptly change the channel it is operating on, and if it switches back, it may observe a “quiet period” of 60 seconds in which is does not transmit any data. Not good.
Enter Splunk.
Splunk is a powerful log analysis tool that you can think of as “Google for the data center.” It takes log data from almost any source and makes it as searchable as Google has made the web. For wireless network engineers, you can quickly and easily search syslog and SNMP data, build reports, and create alerts. Splunk Light is free and will process up to 5 GB of data a day, which should be plenty for most WLAN’s. It also runs easily on macOS if you just want to demo it locally.
Using Splunk I very quickly created this dashboard of real DFS data from SNMP traps coming from a Cisco WLC. It’s a little rough around the edges still (I need to figure out how to clean-up those AP names and channels), but it still shows me a lot of the valuable data.

I can easily create email alerts too, so that if a DFS event occurs an email is triggered, or if say 10 DFS events occur within 30 minutes an email is triggered.
How To
I installed Splunk on a Mac then setup the built-in snmptrapd to listen for incoming traps and log them to a file. For snmptrapd to interpret the SNMP traps from a Cisco WLC, download the Cisco MIB’s and copy them to /usr/share/snmp/mibs/. Then you can start snmptrapd.
Here’s the CLI one-liner to do that:
sudo snmptrapd -Lf /var/log/snmp-traps --disableAuthorization=yes -m +ALL
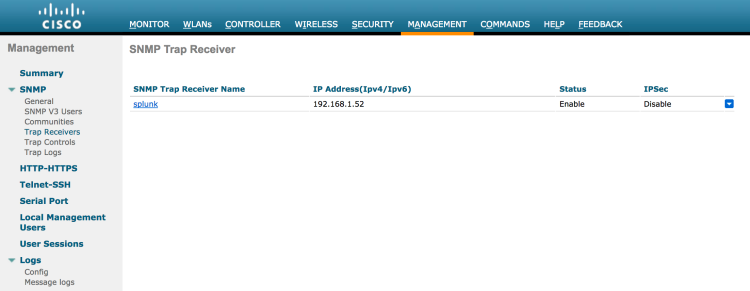
Next configure the WLC to send SNMP traps to the Splunk box by adding its IP address under Management -> SNMP -> Trap Receivers. While you’re there go to Trap Controls and turn everything on you want to analyze.
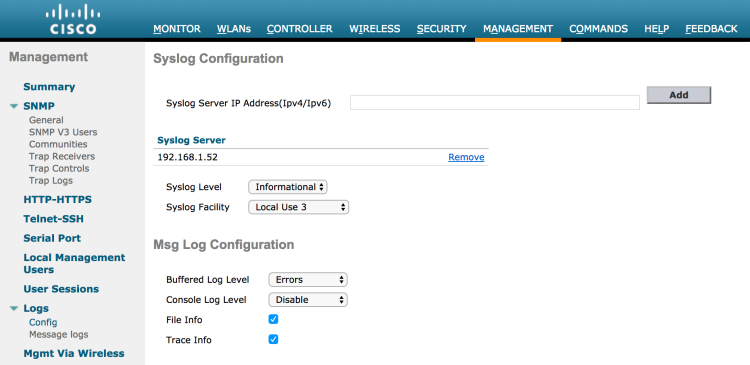
Even though DFS events only generate SNMP traps, it’s still a good idea to send syslog messages to Splunk too, so do that under Management -> Logs -> Config. Set the Syslog Level to “Informational” to get a lot of good data. “Debugging” is probably way too much. The Syslog Facility isn’t important.
Monitor the file snmptrapd is writing traps to to make sure it is working. Run this command on the Mac and you should see traps streaming in. If not you have some troubleshooting to do.
tail -f /var/log/snmp-traps
Now add the file to Splunk under Data -> Data inputs -> Files & directories, and you should be able to see the traps in searches.
Have a look at Splunk’s documentation on SNMP data for more setup help. Setting up syslog is easier. Under Data -> Data inputs -> UDP add UDP port 514 with the Source type “syslog.”
Once the data is coming into Splunk you can start searching it and creating fields. Search “RADIO_RC_DFS” (with quotes) to see all the DFS traps. From that search click “Extract new fields” and select the tab delimiter to parse the data. Give the AP name field a label, and then you can create visualizations of DFS events by AP name. Any search can also be used to trigger an alert, such as an email.
Cisco has published a WLC SNMP Trap Guide as well as a WLC syslog Guide that is helpful when working with this data. Find the messages you are looking for in those guides, then search for them in Splunk.
From there it’s all up to your own creativity. DFS events is just scratching the surface of Splunk’s potential. You can look at authentication events, monitor RRM, and there might be some interesting roaming analysis that can be done with this data as well. I’m sure there are some bright engineers out there that have taken this a lot farther. Please share your work!

The link to the WLC Trap guide isn’t pulling up (404). Any alternate?
LikeLike
Thanks for catching that. I fixed the link.
LikeLike